Vitakraft wants to stay ahead in a transforming market and take advantage of trend and category opportunities. The pet care market is in continuous flux – driven by megatrends such as sustainability, urbanisation, and demographic transition as well as macrotrends in e.g. packaging trends, or effects of the Covid-19 pandemic. The industry’s rapid transformation opens fleeting windows of opportunity for new products, business model innovation, and category expansion. With our data-driven strategic intelligence, Vitakraft can identify and evaluate these opportunities, ensuring their offerings resonated with both current demands and emerging trends timely.
GOAL
IMMEDIATE IMPACT:
Pinpoint immediate category opportunities and competitive insights based on consumer interest
FUTURE-FORWARD INSIGHT:
Explore growing trends shaping the present and future market landscape drawing on expert listening
CHALLENGE
Vitakraft aimed to identify and engage with market opportunities that were not only significant in size and growth potential but also synergistic with their existing product range and market perception. The task extended beyond mere identification; it was about engaging a diverse stakeholder group through an innovative, data-driven methodology for scouting opportunities with precision.
SOLUTIONS
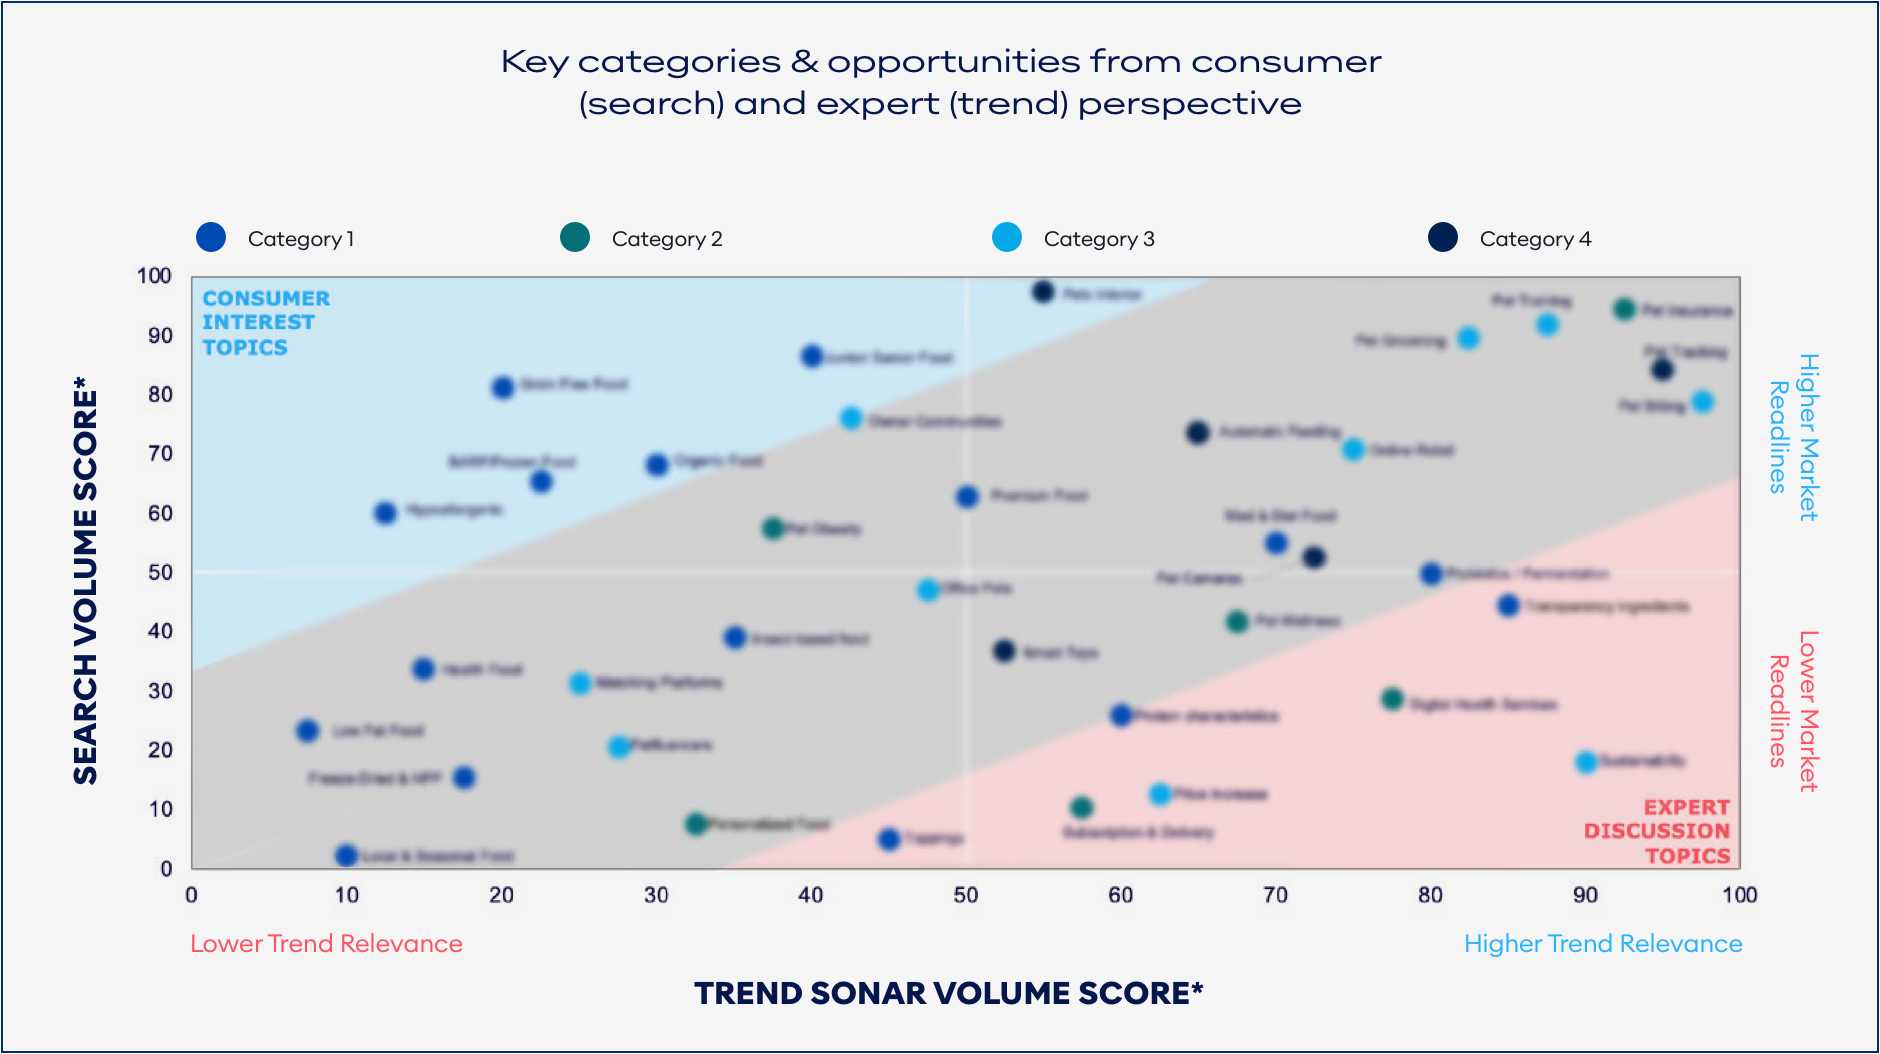
TD Reply provided visibility on market opportunities, category gaps, (new) category attractiveness, and strategic recommendations on category approach through consumer interest- and competitive analysis utilising advanced search data analytics. We meticulously evaluated the overall health of various categories, Vitakraft’s and its competitors’ market conquests, and pinpointed high-momentum areas within the industry.
To set the direction for long term development strategies we analysed market readiness of key trends shaping market & consumer needs (made tangible through best cases) and their diffusion along the trend lifecycle. We decoded the impact on current and future businesscategories and advised Vitakraft on how to embrace these trends effectively with the help of expert listening.
OUTCOME
The collaboration between Vitakraft and TD Reply laid a robust foundation for opportunity capture strategies, enabling the crafting of new value propositions, products, and services that are not just relevant short term but have lasting impact on long-term sustainable business growth.
Partner with TD Reply today to capture the growth and innovation opportunities of tomorrow with high precision category and trend analysis. Get in touch with our expert Dr. Philipp Dauderstädt.
Europe’s largest airline is now collecting data on customer experience centrally in a portal that enables advanced analysis using various specialized large language models. This allows Lufthansa to better tailor its offerings to the wishes and needs of its customers.
GOAL
Effectively utilizing customer-related data.
At the Lufthansa Group, Europe’s largest airline, the term “customer journey” can be taken quite literally. Throughout their travels, passengers come into contact with the company at countless touchpoints—from online booking to personal contact on board to subsequent customer surveys. All these interactions enable the Lufthansa Group to collect valuable information about what individual customers think or how they rate certain services.
In the past, transforming this information into valuable insights and distributing it across the company required time-consuming and labor-intensive manual analyses. To address this challenge, Lufthansa enlisted the help of TD Reply to develop a centralized portal that would streamline the processing and evaluation of data through automation.
CHALLENGE
Better understanding the needs, wishes, and pain points of passengers using generative AI.
SOLUTIONS
Advanced analytics and external data sources:
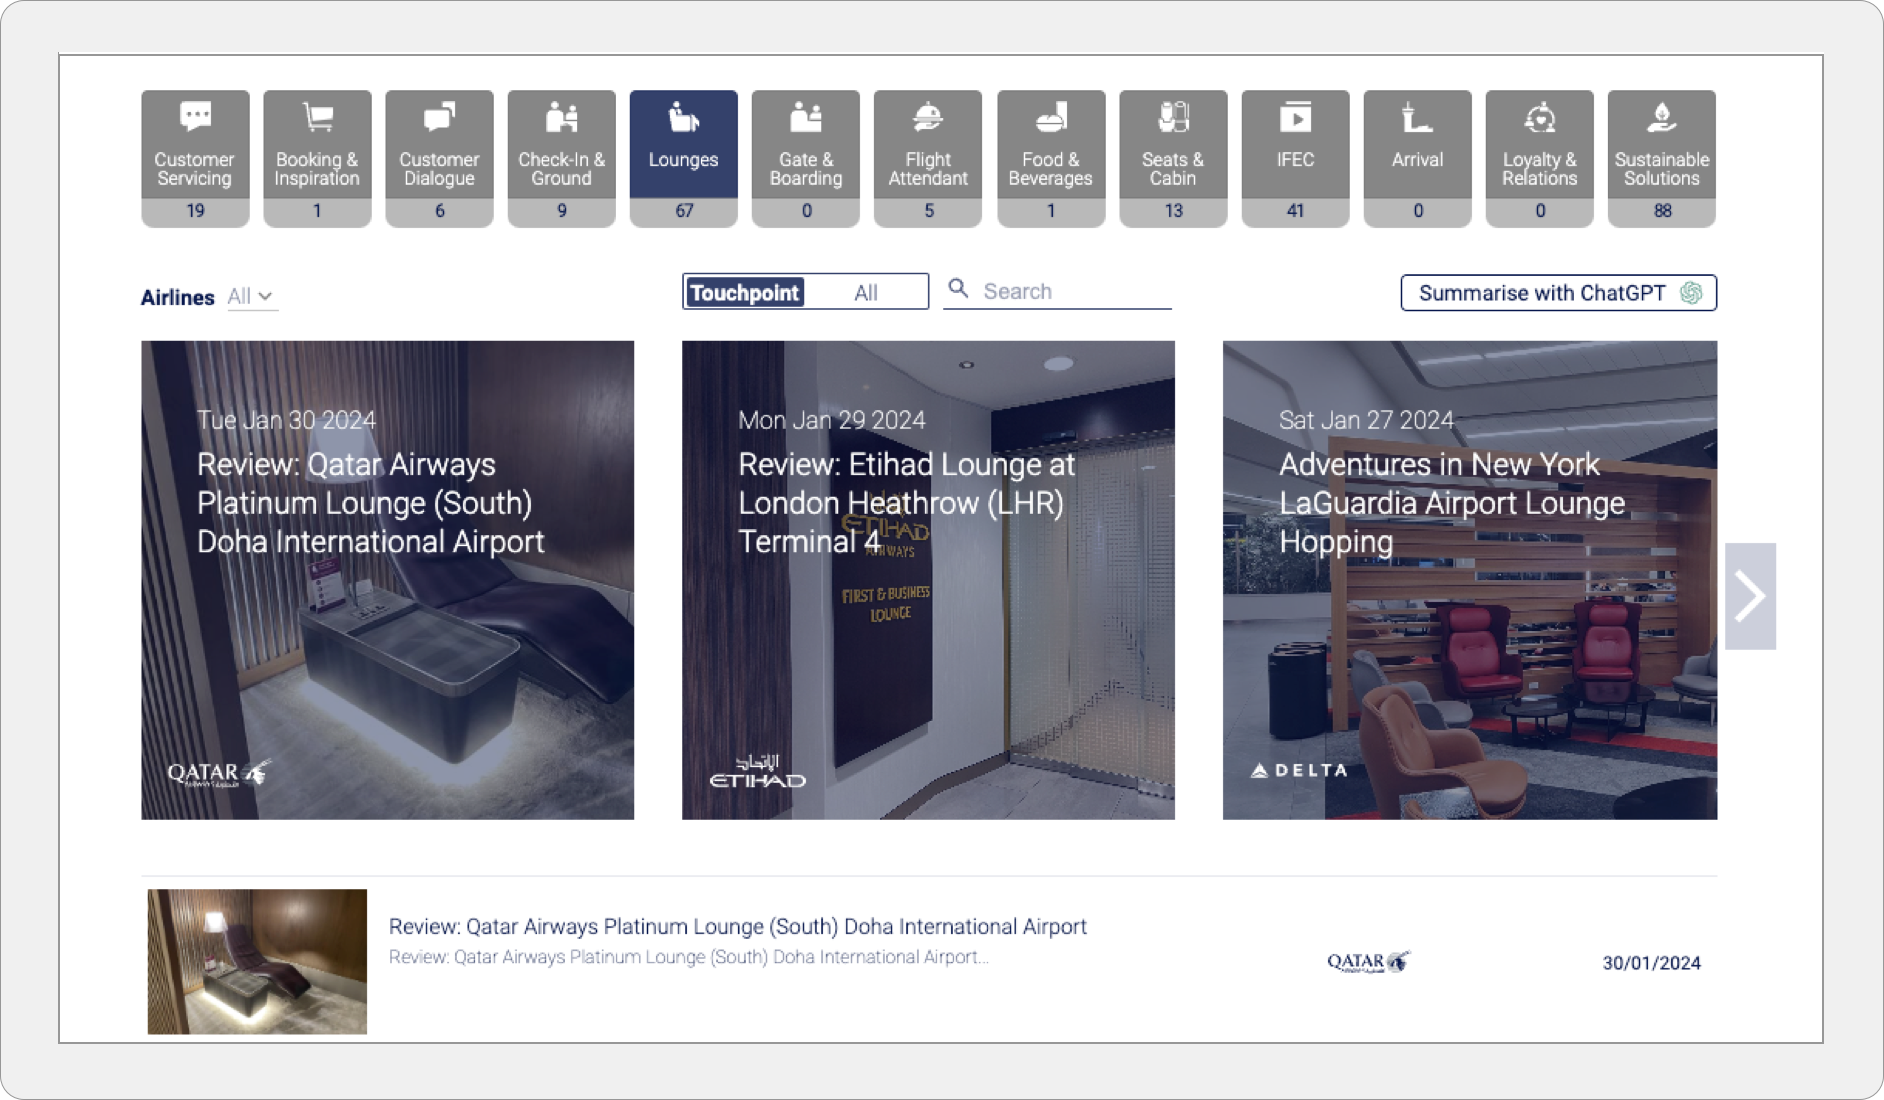
The new Customer Insight Hub developed by Lufthansa Group leverages advanced analytics to provide a deeper understanding of customer needs, preferences, and pain points. The portal centralizes the collection of all customer-related data, including ratings, and utilizes artificial intelligence to automate data analysis. By incorporating external data sources such as press reports and trend studies, the hub provides product and marketing managers across the company with comprehensive insights, enabling them to make data-driven decisions that improve the customer experience.
The chatbot interface of the Customer Insight Hub offers two convenient ways for users to access insights:
Predefined Prompts:
Users can quickly generate summaries on specific topics or obtain an overview of customer pain points and gains by utilizing prefabricated commands.
Open-ended questions:
Product and marketing managers can also ask the chatbot individual, custom questions to gain personalized insights into customers’ experiences with their services.
Strategically fueling and transforming a brand necessitates precise brand activation management aligned with defined objectives and a multifaceted assessment of brand impact. The Brand Impact Accelerator (BIA) empowers BMW campaign and experiential managers to make informed decisions and foster a culture of learning within the organization. Over the past few years, we’ve critically evaluated more than 50 brand activations, ranging from ArtBasel to the IAA, to assess their strategic brand impact and utilize these insights to enhance the efficacy of future activations.
GOAL
The BIA program was designed to achieve three primary goals:
Goal-Oriented Management: :
Establish a goal-driven steering process that engages all pertinent stakeholders.
Unified KPI Framework:
Create standardized Key Performance Indicators (KPIs) for strategic and tactical activation management.
Granular Brand Image Measurement: :
Develop measurement constructs that enable a detailed assessment of the BMW brand image.
CHALLENGE
The challenge lay in crafting and implementing a data-driven approach that aligns with event and campaign managers, channel owners, the BMW in-house agency, The Game, as well as the KOL agency. We aimed to cultivate a data-driven culture within the BMW Brand Impact Council.
SOLUTIONS
Shared Vision: We embarked on defining a collective vision spanning the entire brand communication landscape.
Stakeholder Alignment: Identifying key stakeholders and uniting them behind the common vision, approach, and KPIs. This involved defining KPIs and constructing measurement frameworks based on digital data, such as organic searches on both event and brand levels, and Digital Brand Equity, a measurement derived from social listening data assessing various facets of the BMW brand image.
Reporting Framework: We established structured reporting formats for pre-event, during-event, and post-event evaluations. This included building a dynamic dashboard and a benchmarking database.
Learning Culture: Our efforts extended to fostering a culture of continuous learning within the organization.
Future Positioning: We also explored opportunities for positioning BMW within the broader competitive landscape.
By implementing the Brand Impact Accelerator, BMW has achieved a more streamlined and data-driven approach to brand activation, enhancing the brand’s strategic impact and aligning all stakeholders behind common objectives.
TD Reply collaborated with Bayer to develop a Digital Trend Radar, that visualizes emerging trends, associated technologies, and their maturity levels. Leveraging cutting-edge tools such as SONAR (data-driven Trend Research) and PULSE (Dashboard and Visualization), TD Reply crafted a robust platform that empowers the Client’s INNO.X program by providing actionable insights into emerging technologies relevant to its diverse divisions and corporate functions.
GOAL
The primary objective of the Digital Trend Radar project was to democratize trend knowledge throughout the organization, fostering innovation and cross-functional collaboration at Bayer with a systematic and easily accessible tool for trend identification and monitoring. Key goals included incorporating trend insights into strategic decision-making processes, prioritizing trends relevant to specific divisions, and evaluating their potential impact on existing business models.
SOLUTIONS
The Digital Trend Radar enables Bayer to incorporate environmental scanning into the Strategy Formulation, improving the prioritization of relevant trends and assessing their impact on strategic initiatives. The development of the Digital Trend Radar included various work packages:
Stakeholder Engagement:
Gathering stakeholder requirements and input to tailor the Digital Trend Radar to Bayer’s specific needs and objectives.
Trend Discovery:
Leveraging TD Reply’s extensive trend universe and employing custom trend discovery methods, over 200 trends were identified, ensuring comprehensive coverage of relevant developments.
Trend Prioritization:
A blend of quantitative and qualitative analyses was employed to quantify and prioritize trends. Using SONAR (our proprietary data-driven trend research solution), we analyzed millions of expert opinions, including blogs, news, patents, and scientific articles. This quantitative analysis was complemented by expert evaluations of each trend’s impact on Bayer, to select the most relevant trends for further in-depth analysis.
Use Case Identification:
Building on the prioritized trends, we identified and described over 250 use cases, offering actionable insights into how these trends could be operationalized within Bayer’s context.
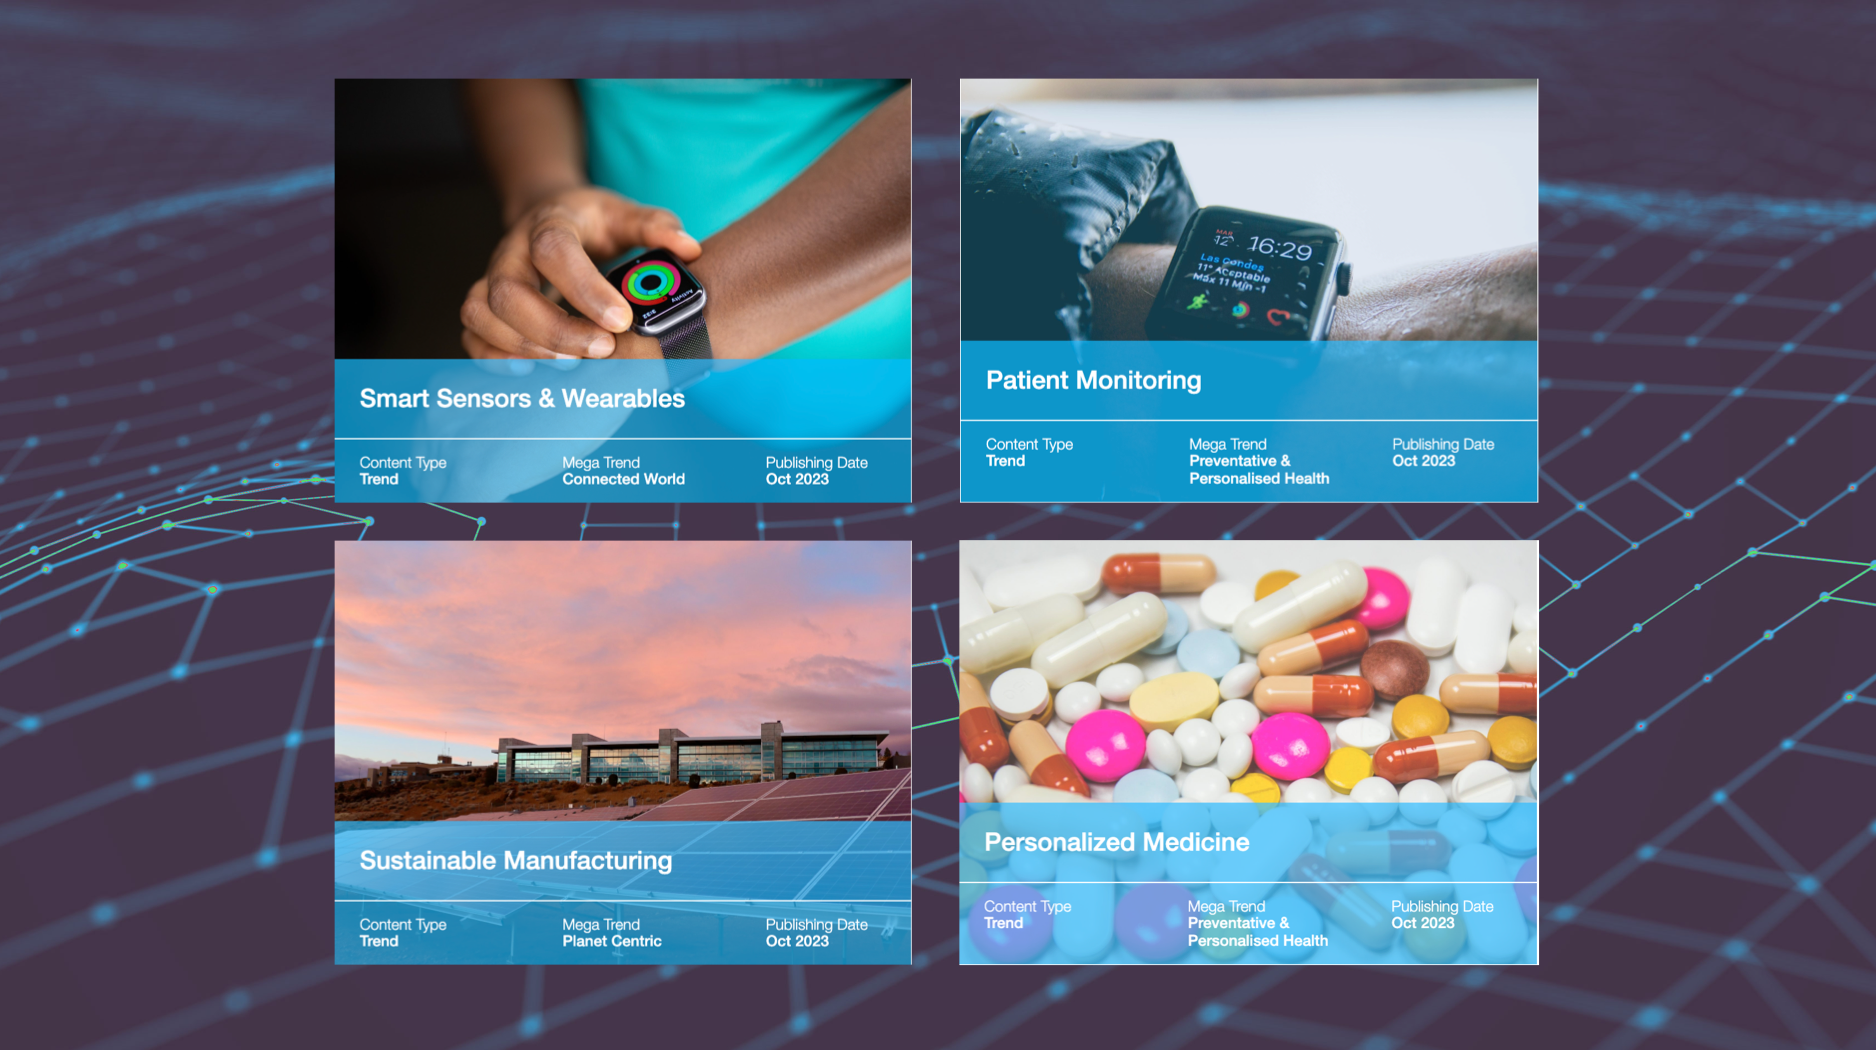
Trend Framework Development:
Based on the extensive research phase, a robust and structured Trend Framework was developed, encompassing Mega Trends, Trend Areas, Trends, and Use Cases. This framework provided a comprehensive overview of the evolving landscape and served as a strategic guide for Bayer.
Ongoing Automated Monitoring:
To ensure the Radar remains up-to-date, an automated monitoring system was established using SONAR. This continuous monitoring allows Bayer to stay ahead of emerging trends and adapt their strategies accordingly.
Definition of Operating Model:
To ensure a seamless integration of the Digital Trend Radar into existing processes and workflows, we defined an efficient operating model.
Trend Radar Set-Up:
The development, testing, and launch phases were executed meticulously to ensure the Digital Trend Radar meets the requirements for functionality, usability, and reliability.
Through these comprehensive efforts, we delivered a state-of-the-art Digital Trend Radar. It supports strategic decision-making, providing trend insights and empowering Bayer to navigate the ever-evolving landscape of emerging technologies and trends.
We support the ANWB in gaining a data- and consumer-driven approach to optimize and streamline marketing activities across the organisation and identify new future value spaces. Throughout the transformation process we realized short term efficiency gains of approx. 10% and mid-term value uplift of approx. 20%.
GOAL
Four major objectives:
OUTSIDE-IN PERSPECTIVE:
A neutral outside-in perspective on consumer needs & market environment
BUSINESS OPTIMIZATION:
Short-term optimization of marketing efficiency to finance growth
FUTURE VALUE SPACES:
Identify & prioritize potential propositions for new market opportunities
TRANSFORMATION STEERING:
Enabling the organization to actively steer acquisition, customer journeys and brand
CHALLENGE
Bring transparency into the value creation mechanics and growth drivers along the business lines and related products & services. Create a data-driven mindset and accountability to support the reorganisation into a platform organisation.
SOLUTIONS
Setup of a roadmap to support the 4 major goals:
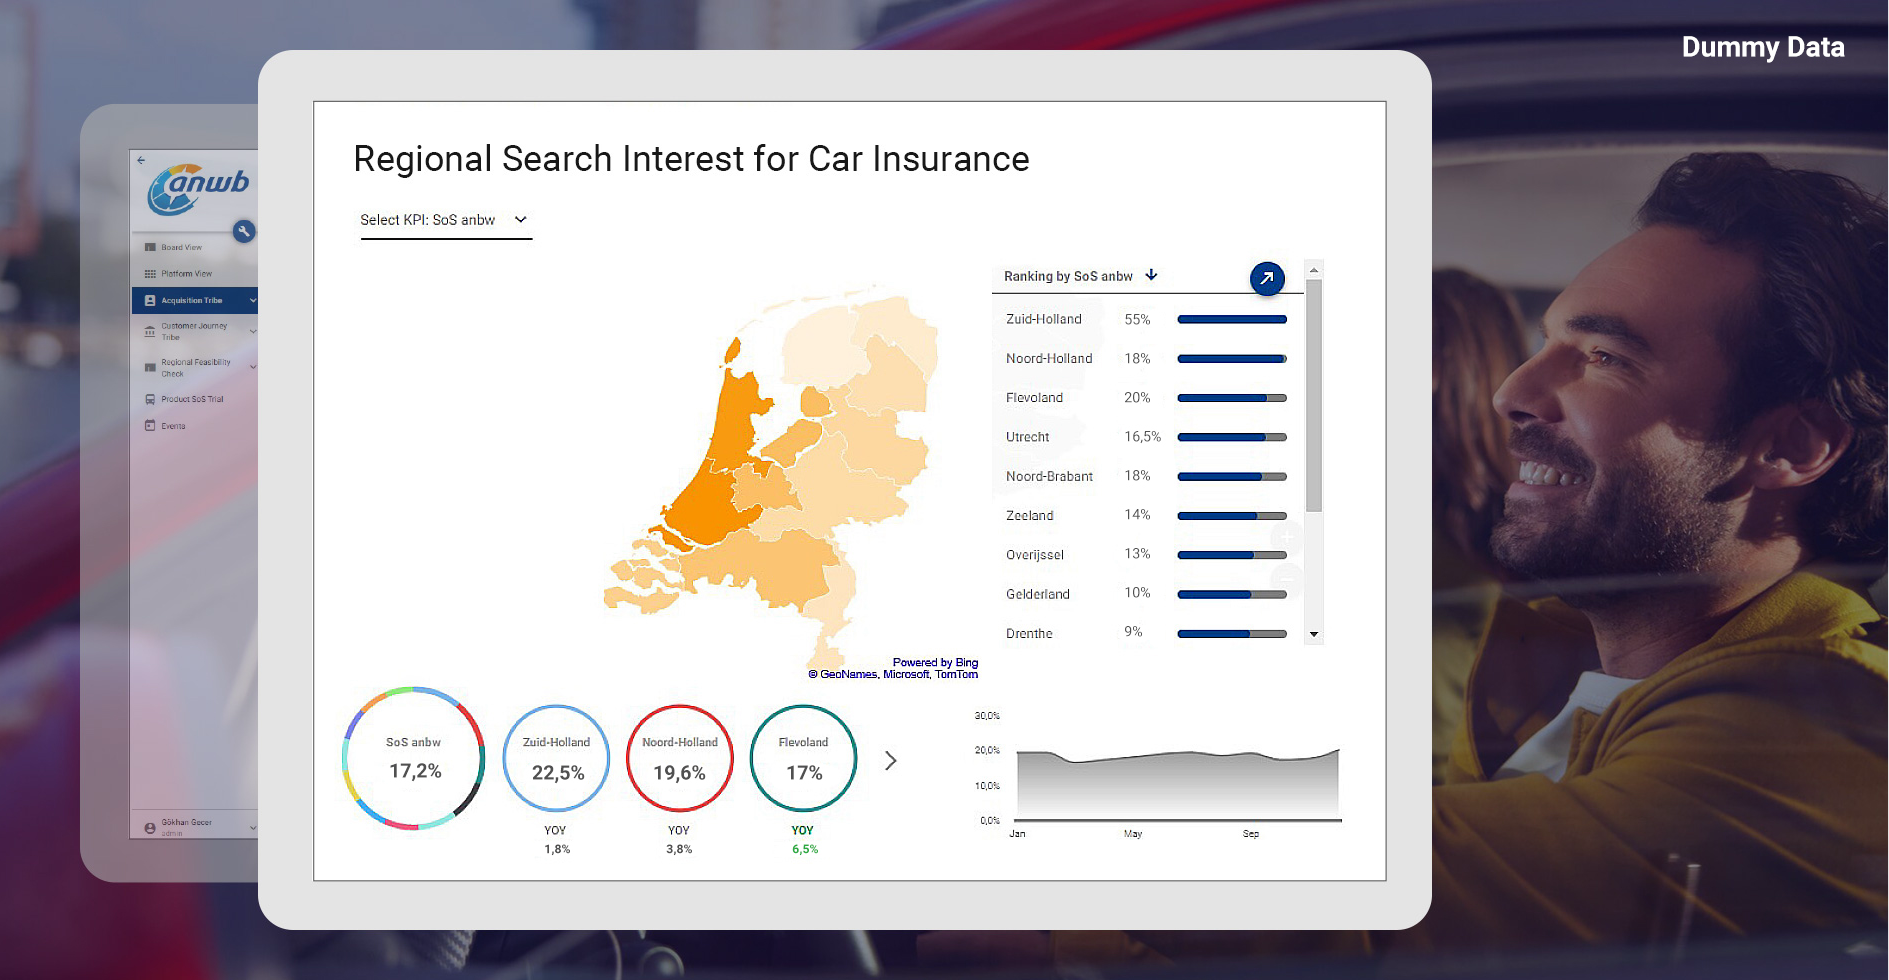
1. Using digital data in particular organic search behaviour and social listening to get a
“voice of the customer” resulting in a detailed picture about:
Consumer interests & needs
Category opportunities & product interest
Communication perception & seasonality
Brand advantage
Competition and new players
Future value spaces & propositions
2. Setup and conduction of several Commercial Effect Modelling to identify and quantify direct and indirect (e.g., brand halo) revenue drivers across all anwb business lines (roadside assistance, travel, insurance, retail) as well as derivation of business line specific growth capture plans
Strategic budget allocation across all business lines
Optimization of paid and owned media, campaign and promotion in terms of timing, frequency, channel and content leading to 20% short- und 30% mid-term value increase
Entry point, customer journey and product assortment refinement
3. Outside-in evaluation of trends and market opportunities by a diffusion analysis based on
a) expert data (patent, scientific publications and mass media via TD Trend Sonar) and
b) consumer data (organic Google search)
Strategic trend framework along the anwb business lines and mapping on anwb value spaces
Prioritized value spaces/innovation funnel for annual business planning
Briefing input for service and product development teams
4. Derivation of a KPI set from the Commercial Effect Models and integration into a Business Steering Cockpit consolidating internal and external data sources
Value focused goal set with corresponding forward-looking KPIs for the entire leadership team.
Steering dashboard for the reorganized anwb platform organization
Collaborative features and engagement processes to bring the people behind the vision and drive data culture.
Ongoing optimization guidance for selected strategic initiatives (e.g., retail assortment, new energy proposition, owned channel architecture)
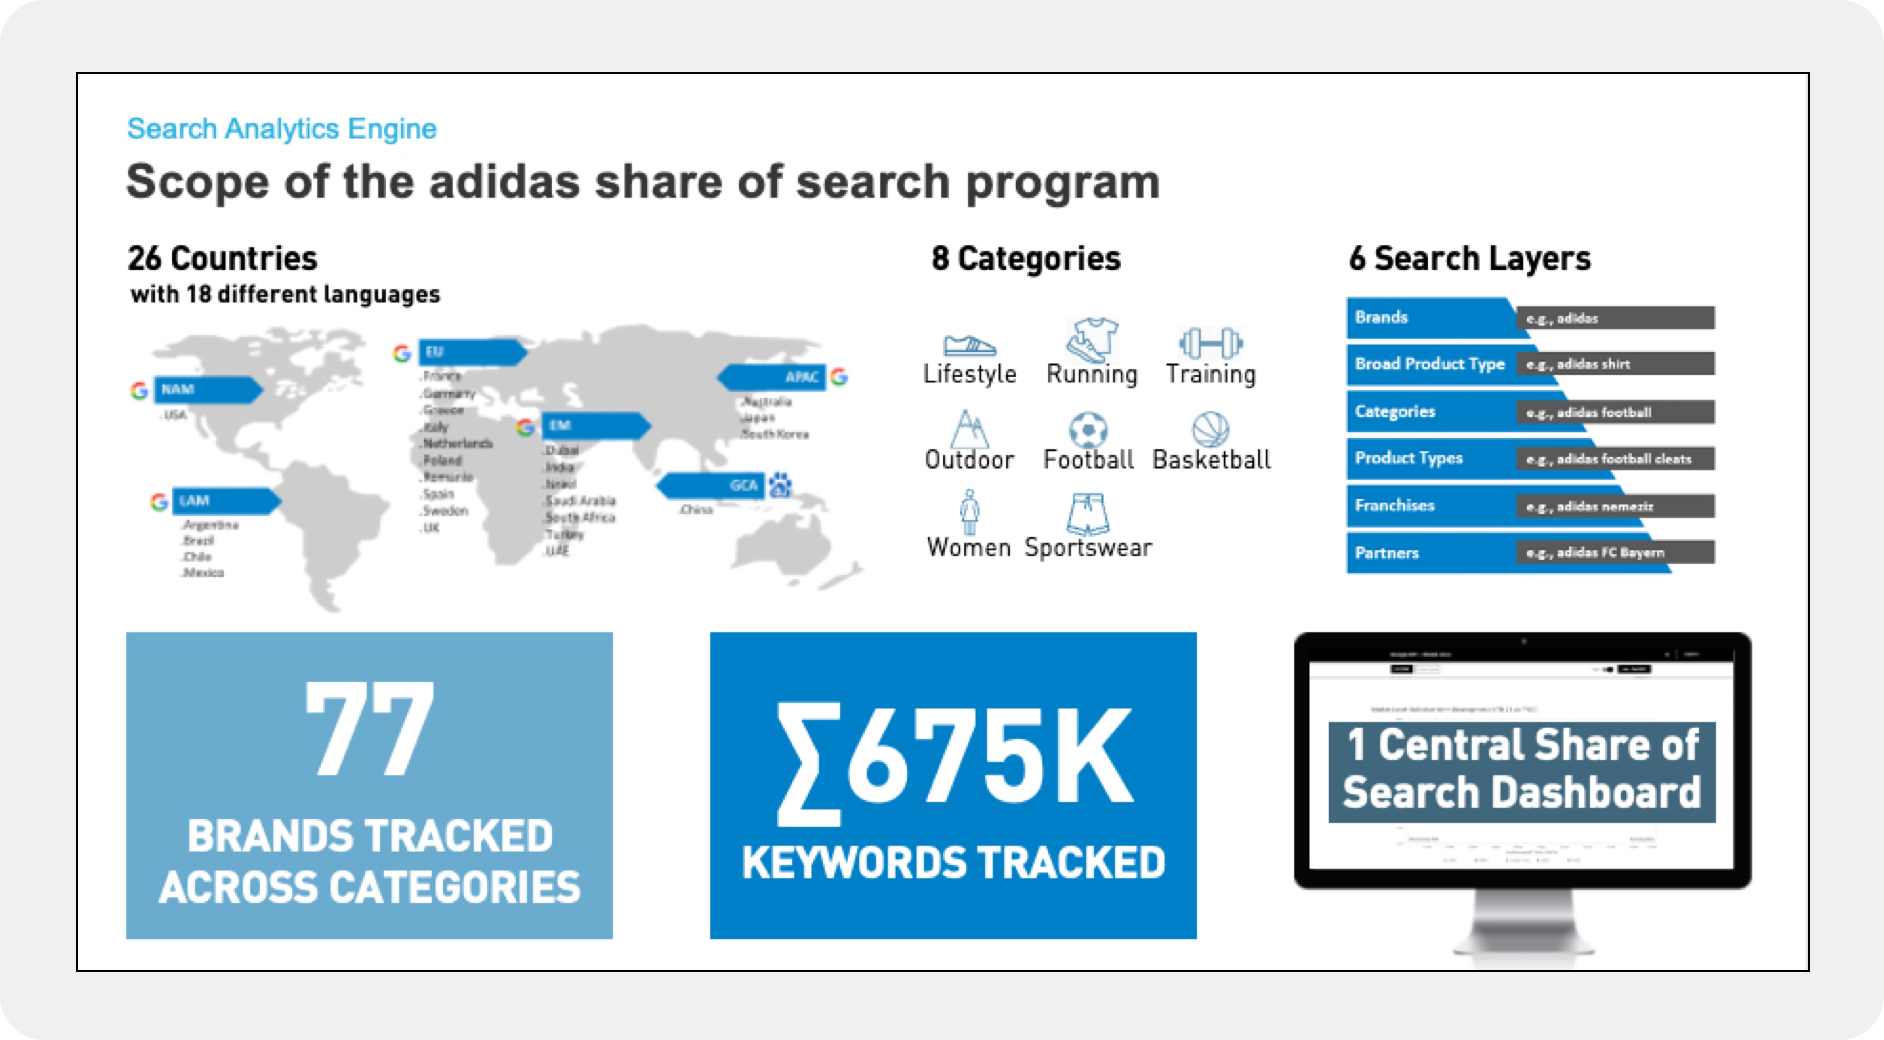
TD Reply has partnered with adidas to establish and manage a comprehensive global brand tracking initiative. The brand share of search program capitalizes on organic search data, integrating ‘Share of Search’ as a pivotal Key Performance Indicator (KPI) for assessing Brand Strength. By tracking organic search data, adidas gains a more precise, data-driven understanding of their brand’s position in a volatile and ever-evolving market. The comprehensive end to end tracking approach of the program facilitates informed, strategic, and operational decision-making and improved adidas’s ability to effectively adapt and thrive in a dynamic business environment.
CUSTOMER GOAL
The main objective of the project was to define a more flexible, granular, and near-time Brand KPI System that leverages digital consumer data to track brand strength, improve measurability and meets the following objectives::
Strong link to business impact :
(Strong correlations of KPI with commercial data and early indication for changes in sales and market share)
Adaptive to changes in the marketplace :
(End to End tracking from an overall Brand level, down to categories, products and partnerships)
In-time Insights:
(high frequency of data gathering to enable attribution of single activities on brand interest)
Efficient to execute :
(Significant cost advantages over existing survey-based Brand Tracking Solution and higher flexibility to adjust scope with access to historical data)
Global Scalability:
(Global Coverage including Baidu, Good Capture of Competitors, Robust Data Volumes across countries)
CHALLENGE
1. Developing a Global End-to-End Tracking System: One of the most daunting challenges was the creation of a tracking system capable of accurately capturing market realities on a global scale. The system had to be:
Scalable Across Diverse Geographies and Languages:
Covering 29 countries and 19 languages, the system required immense scalability and adaptability to accommodate diverse market nuances and linguistic variations.
Comprehensive for Multiple Categories, Brands,
and Products:
With the inclusion of 8 categories, over 70 brands, and hundreds of products, the complexity of the system increased exponentially. It needed to be robust enough to handle vast amounts of data while remaining precise in its analysis and reporting.
2. Balancing Stability with Market Dynamics: Maintaining the stability and comparability of the tracking system, while adapting to ever-changing market dynamics, was a critical balancing act:
Integration of New Market Elements:
The system had to be flexible to integrate new brands, products, and partners without disrupting the existing data’s consistency and historical comparability.
Responding to Rapid Market Changes:
Adapting to market dynamics in real-time, without compromising the integrity and relevance of the KPI, was paramount in a swiftly evolving market landscape.
3. Senior Management Buy-In: Securing senior management buy-in for a new KPI based on digital behavioral data was a significant hurdle:
Shift from Traditional Methods:
Convincing the leadership to move away from traditional survey-based data to a more digital-centric approach required a strategic approach.
Proof of Concept for Trust Building:
Extensive validation and testing in the initial Proof of Concept phase were critical in demonstrating the effectiveness and reliability of the new KPI, thereby building trust in the digital approach.
Internal Education and Communication: Post gaining senior management buy-in, the next challenge was to foster a collective understanding of the new KPI across the organization:
Engaging Diverse Departments and Business Units:
Conducting internal presentations and engaging directly with stakeholders across different business units, departments, and markets was key in educating and aligning them with the new system.
Facilitating Open Dialogue:
This approach was not just about information dissemination but also about encouraging open dialogue, addressing concerns, and nurturing a collaborative environment, essential for the smooth adoption and implementation of the new system.
SOLUTIONS
The project adopted a “Pilot, Test, Scale” approach to develop and implement a global brand tracking system using Share of Search as a central KPI. The Share of Search tracking scope covers 70+ competitors, 8 categories, and hundreds of products and partnerships in 18 languages and 29 international markets (including China through Baidu Search).We embarked on defining a collective vision spanning the entire brand communication landscape.
1. Share of Search Pilot and Extensive Validation:
The initial phase focused on evaluating the feasibility, validity, and relevance of using organic search data as a Brand Strength KPI.
• Building a Comprehensive Topic and Keywords Framework: A detailed framework was created encompassing over 600,000 keywords across brands, categories, partnerships, and products. This framework enabled granular insights across key layers such as Brand, Category, Product Type, and Franchises.
• Data Gathering, Analysis, and Sense Checking: The process involved collecting and analyzing data on both brand and category levels, including volume and share rankings, and search-sales correlations.
• Evaluation of Results Based on Success Criteria: The success of the pilot was measured against several criteria, including the ability to reflect market realities, tie to business performance, adapt to market changes, provide timely insights, execute efficiently, scale globally, and capture competitors effectively.
The outcome of this phase was the successful buy-in from senior management for a global rollout, underpinned by the pilot’s demonstration of the system’s efficacy and scalability.
2. Global Share of Search Program Implementation:
With the successful completion of the pilot, the project moved into its global implementation phase.
Market Rollouts: The program was expanded to additional markets, tailoring the approach to each region’s specific needs.
Tracking Scope Definition, Governance, and Management: This involved establishing the business logic, ensuring comparability, and managing stakeholder expectations across various brands, categories, and markets.
Infrastructure Development: The implementation included setting up a robust tracking infrastructure with data pipelines, dashboarding, and reporting formats.
Target and Ambition Setting: Based on historical growth patterns and projections, target ranges were defined using different growth functions.
Ongoing Reporting and Insight Generation: The system provided continuous reporting, offering crucial insights for strategic decision-making.
Informing Annual Strategy Process: Insights generated from the system played a key role in shaping the annual strategy process, aligning it with real-time market dynamics and brand performance metrics.
By adopting this structured approach, the project successfully implemented a comprehensive, scalable global brand tracking system. It not only provided valuable insights into brand performance but also equipped the organization with a dynamic tool to navigate and adapt to the ever-changing market landscape.
RESULTS
Highly granular and comprehensive End to End tracking solution
Significant cost advantages over existing survey-based Brand Tracking Solution
Increased flexibility to continuously adjust tracking scope with access to historical data
Leading indication for changes in sales and market share
Better attribution of single activities on brand interest.
Use smart data to enhance traditional market research
Identify new sales stories, trends, and consumer needs based on search data
Support content and marketing managers in their decision-making
CHALLENGE
Handling the analysis of over 6,500 search terms
Automating the smart data approach
SOLUTION
TD Reply helped DekaBank to identify trending marketing content that is relevant to the needs of its existing and prospective customers. Analyzing over 6,500 search terms and applying various algorithmic approaches, TD Reply created consumer-centric sales stories that were highly relevant to the target audience.
Thanks to an easy-access “insights dashboard,” DekaBank employees can keep track of current consumer trends based on Google search data. Additional 360-degree trend reporting allows DekaBank to take deep dives into its potential content fields.
The dashboard thus allows DekaBank to monitor the financial needs and business growth of its customers and prospects much more frequently and in greater detail than traditional market research would ever allow.
In the process of exploring new and innovative ways to initiate a data-driven transformation process, Döhler has three key objectives:
Enhancing the decision-making process through data-driven transparency
Improving consumer/customer/competitor intelligence by identifying action fields and opportunities
Initiating a data-driven business transformation process by implementing a company-wide smart data solution across the entire value chain
CHALLENGE
Understanding and assessing the current smart data readiness and information needs of each department, and the development of a smart data roadmap
Exploring new data sources and methods to gain insights and evaluate the business value
Gathering and analyzing new data in order to identify growth opportunities and action fields (e.g. data as a service) that can be developed outside of Döhler’s core business for commercialization with partners, customers, etc.
SOLUTION
Market Intelligence Dashboard
The automated dashboard reflects company-specific use cases allowing the comparison of different brand and ingredient KPIs to identify market opportunities and trigger innovations and sales. Furthermore, the dashboard provides cross-cutting approaches that ensure holistic ecosystem-based management, including customer, competitor, sourcing, and processing views. The comprehensive source set includes a wide range of data, including Euromonitor data and Mintel insights, as well as buzz and search data.
Due to the critical role of key franchises for overall commercial success (Top 10 franchises make between 40-70% of overall revenue across the top sportswear brands), adidas wanted to gain deeper insights on how franchises should be managed and tracked along their lifecycles in the market.
Specifically, the client wanted to:
Understand Market Mechanics
Review Competitor Best Practices
Improve Franchise Management
CHALLENGE
As the scope of the analysis was on understanding life cycle mechanics and patterns one key challenge was to gain “long enough” historical timeseries data, especially for key franchises that are at later stages of the life cycle.
Another challenge was to identify success factors and leading indicators for franchises success across brands and categories.
SOLUTION
TD Reply conducted an extensive Research Project analyzing 52 Franchises across 7 Brands in 5 sportswear categories.
Understand: Identification and fitting of franchise curves to statistical distributions, clustering of franchises by distribution parameters and splitting life cycles into stages
Locate: Creating a KPI set with benchmarks based on average stage performance to track franchise performance
Predict: Prediction of life cycle development in terms of the height & length of life cycles and stage entries
Steer: Development of lifecycle & portfolio frameworks (product launches, iterations, activations, …) to advance franchise management & planning
The analysis and modeling were based on around 1 Mio. data points and 17 KPIs including internal client’s data (e.g. article invest, sales and discounts), external market data (e.g. market shares) as well as digital data generated by TD Reply (e.g. google search, social media buzz and franchise image buzz).
Results of the project have been presented to the board and senior management across key business units and are used for portfolio and franchise lifecycle management decisions.
Drive strategy and execution from a brand perspective through a digital brand tracking system that can:
Measure the level of brand equity for adidas and competitors in near real-time
Gives insights on how products, assets and campaigns are perceived and how they contribute to the overall brand perception
Measure the contribution of the brand to overall marketing success and sales
CHALLENGE
The initial challenge was to translate abstract brand personality and image items that have been tracked through traditional surveys into consumer language that enables us to track and analyze consumer conversations related to the brand drivers on a very granular level (besides overall brand perception we are able to understand how individual franchises, drops, technologies, assets etc. are perceived by consumers).
Another challenge within the project was to drive change and acceptance within the organization. As we know data projects are change projects, thus the internal communication together with the owner on the client side, was and still is a key aspect of the overall project.
SOLUTION
TD Reply developed a new approach to track the brand values of adidas and key competitors by analyzing digital data. The process involved the following steps:
Brand Meaning: Itemization of adidas brand values by translating all brand-relevant dimensions into consumer language and identifying key digital brand drivers.
Brand Performance: Data Gathering and analysis of the Digital Brand Perception for adidas and Competitors on different levels:
Brand Level
Sport Category Level
Franchise / Asset Level
Campaign Level
Brand Mechanics: Creation of an Input-Output-Outcome Model to better understand Marketing Cause-and-effect relationships and optimize the allocation of brand assets to maximize brand impact.
The approach was developed and tested in the US as pilot market and is rolled out across markets (Germany, UK, France, Japan, China).