We are happy to announce the release of the Pulse 2.55.0 “Baby Lia” update!
In order to celebrate the arrival of the newest member of the TD family, this month’s iteration of our data story-telling solution Pulse is named after Lia, the newborn daughter of Martin Schmoll, our Director of Data-Driven Business Innovation. She will definitely change Martin’s life – and “Baby Lia” will also change the lives of Pulse users, as it comes with a variety of very useful new features.
We at TD Reply are experiencing through multiple interactions with our clients that the theory of our world turning more and more into Volatility, Uncertainty, Complexity and Ambiguity is an undeniable truth. This is commonly described as the “VUCA world” phenomenon. A good way to deal with it for an organization is by fostering Vision, Understanding, Clarity and Agility. The improved and new contextualization features that “Baby Lia” brings along are designed to help our clients to do just that.
What’s new in 2.55.0 “Baby Lia”:
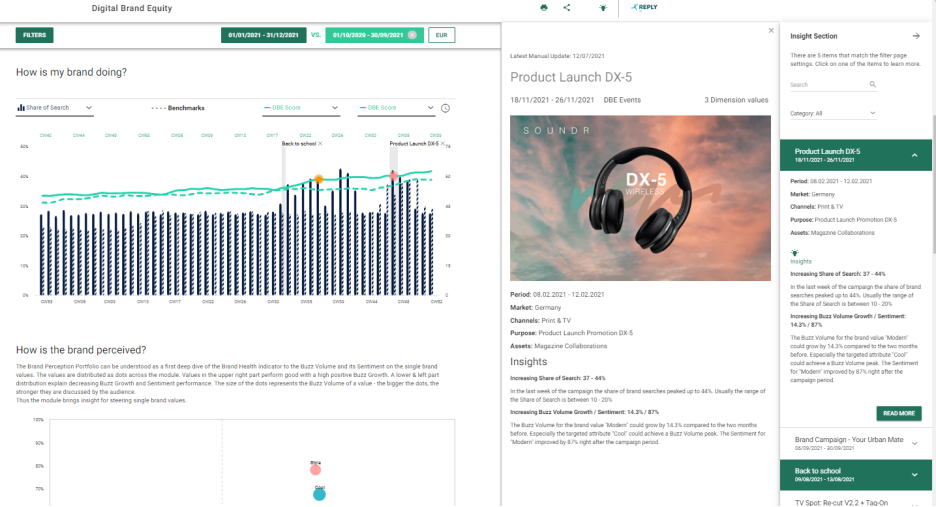
Fixed Period Benchmark in the KPI Explorer– The Fixed Period Benchmarking function in the KPI Explorer is one of the definite highlights of this new Pulse release. This feature propels one of Pulse’s popular go-to-module for KPI comparison and contextualization to becoming one of the most capable modules in terms of analytical prowess, making answering key business questions with Pulse even easier than before. You can now track up to three KPIs along two adjustable time series of the same length in order to help you track, benchmark and compare their development. It also allows you to display events for both time periods on screen.
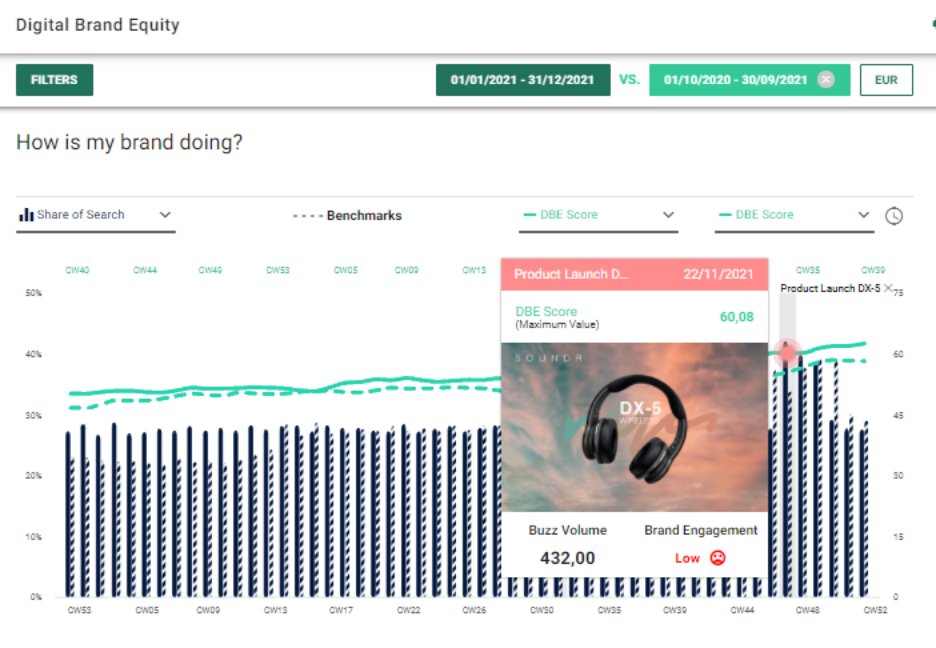
Brand Health Indicator – Enables you to completely dissect the impact of an event on a KPI during that event timeframe! As an extension of the last releases’ KPI EventAnalyzer, we are now able to also incorporate relating event information to the marked outliers as well as adding additional KPIs into the analysis. Based on the values displayed, an assessment of the KPI performance in the context of the item analyzed is shown. The most common use case might be assessing your brand health using an established respective KPI alongside another outlying KPI during a particular event timeframe, hence this feature’s name.
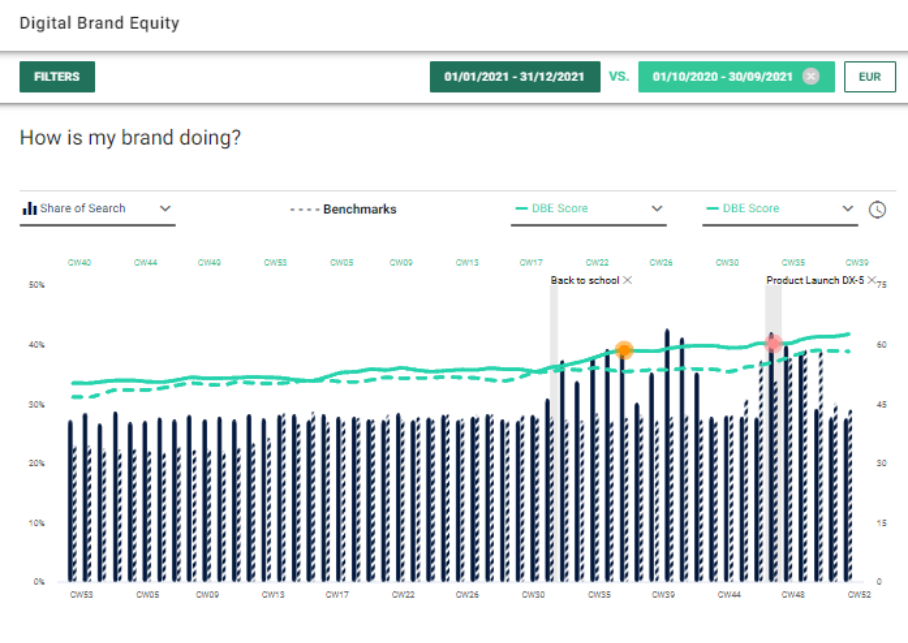
Automated Event Period Analysis – An extremely powerful tool for data contextualization! This feature allows you to analyze any KPI in your timeline charts as it checks it for outliers (either being above / under static values or relative to the KPI’s average value) during the timeframe of a specific event from the insight section. Also, it is one of the most remarkable Pulse features in terms of overall connectedness and complexity as it combines Fact, KPI, Module and Event Setup.
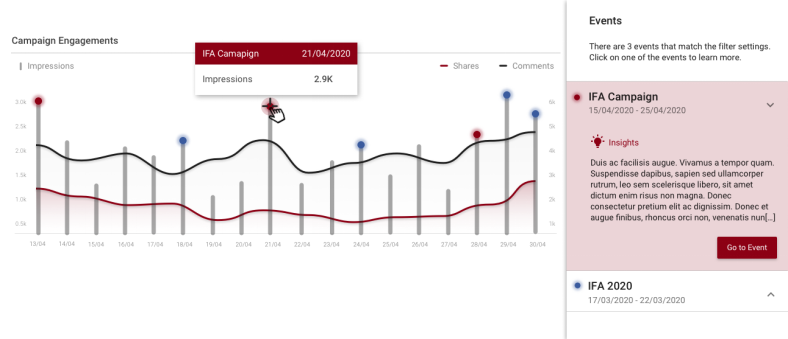
Improved Event & Insight Readability – In Pulse, we offer the possibility to contextualize data with events and related insights. This improvement allows you to read-up on events without losing focus or your dashboard page at all, as information is now presented in the same tab.
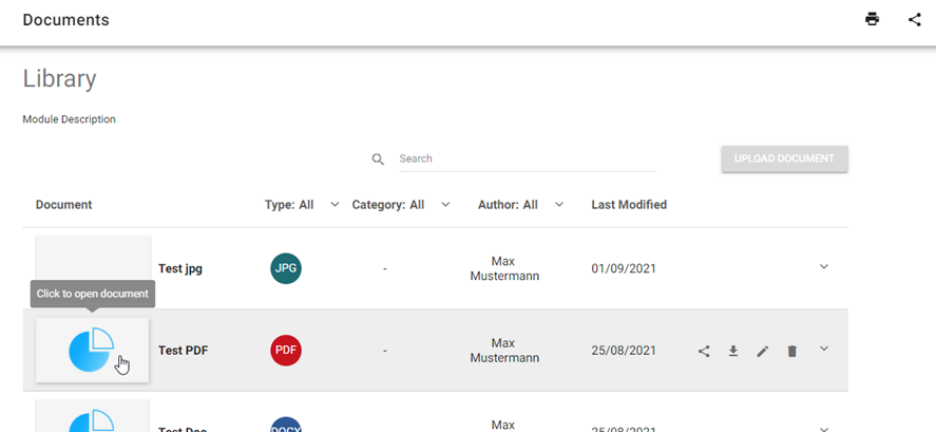
Document View in Browser – Due to the recent improvements extending Pulse’s capabilities to store and curate business relevant documents, we now extended this function to allow the view of PDF documents right in the browser. No longer users have to unnecessarily download files.
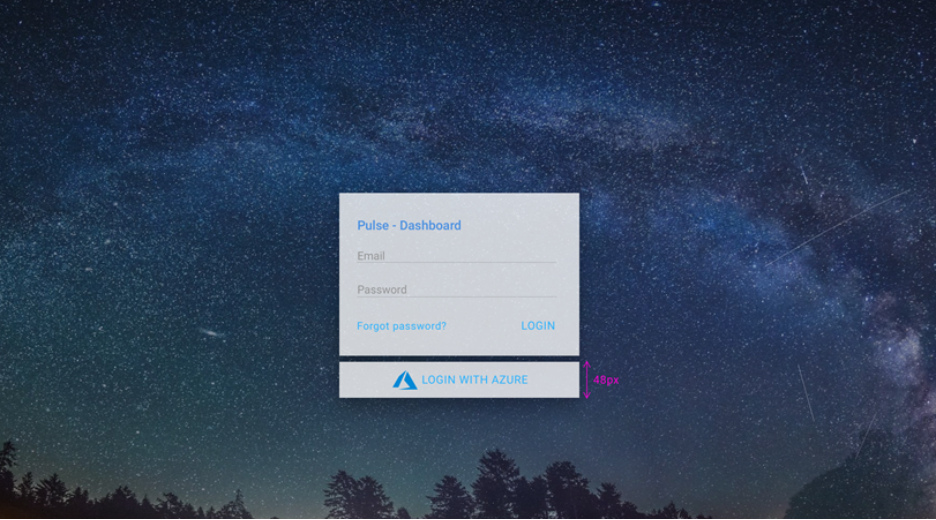
Single-Sign-On with Azure – The function is similar like e.g. a “Login with Facebook” function only it is an Azure account in our case. The Pulse user rights & roles of a SSO user are considered & applied with a SSO. This solution is a blueprint for potential Pulse SSO requests in the future!