
Late last year, Les Binet, arguably the world’s most respected expert on advertising effectiveness, introduced a distinctive metric to a wider audience: share of search. It has since seen an explosion of industry press coverage and for a good reason. At TD Reply, we have been using share of search for several years as a cost-effective, timely, and accurate method for answering a wide range of high-level marketing strategy questions. While many industry experts have espoused its virtues as a proxy for share of market or an indicator of the media spending efficiency, its benefits at the level of regional marketing have not yet been acknowledged.
What is it and what can I do with that?
The math behind the metric is fairly simple. To calculate a brand’s share of search, you take the total number of all organic searches for a brand and divide it by the total number of all organic searches for all brands in the relevant category over a certain period of time. The search data can be obtained from Google Trends, among other sources.
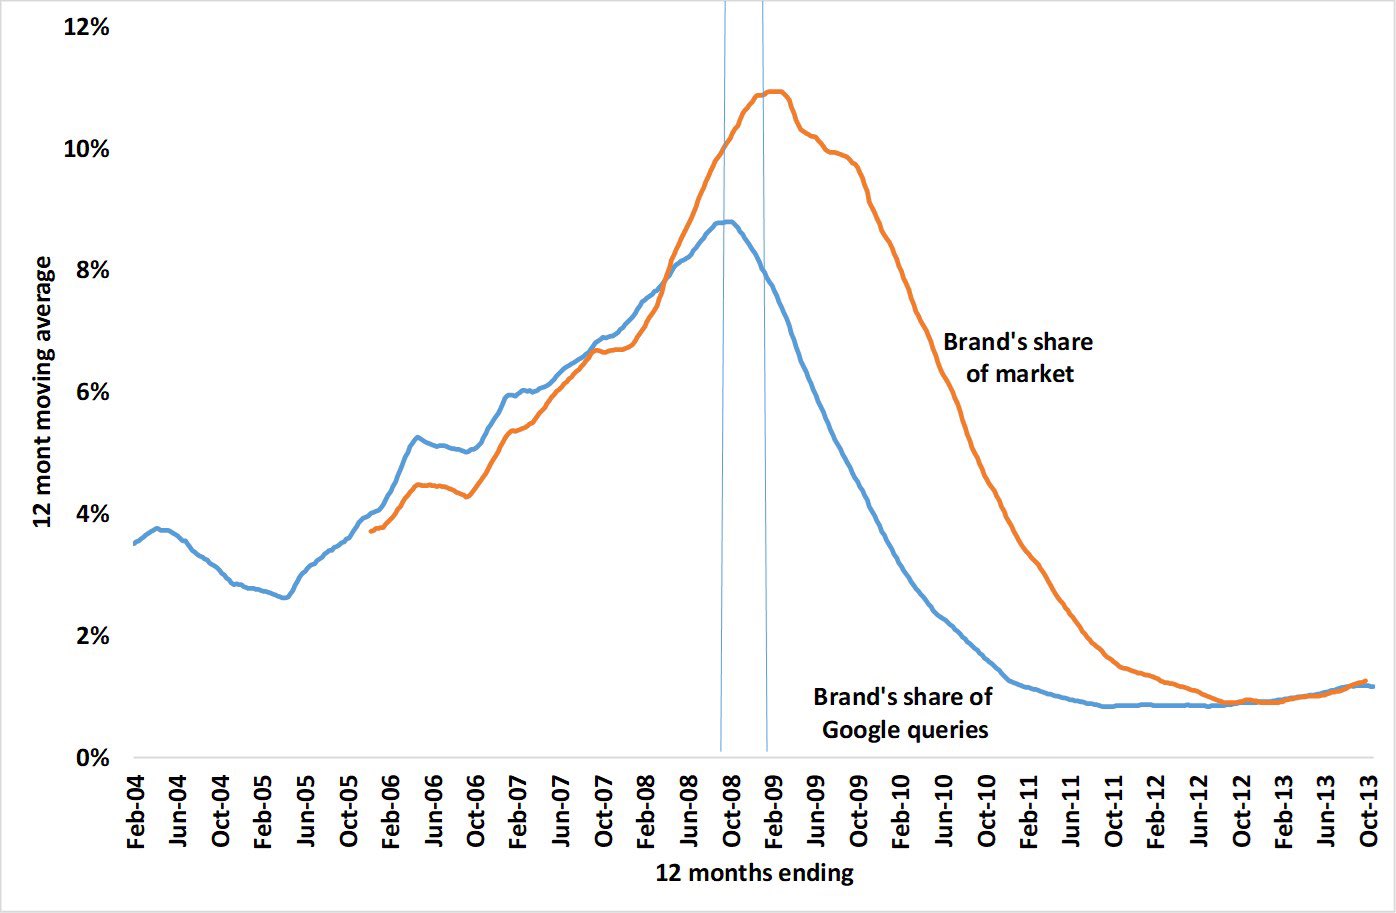
At the EffWorks Global 2020 conference, Les Binet presented some of the impressive insights that can be achieved with the help of search of search. He found that share of search is not only a strong predictor of market share, but can also act as a convenient way for measuring brand health.
But there is more to this metric. Share of search also enables uncovering regional brand growth opportunities that can be easily missed when relying on common market research methods. That is particularly true when looking at booming developing economies such as Vietnam, India, Indonesia, or the Philippines, where regional differences are substantially more pronounced than in Europe or the US.
For a leading global dairy company looking to increase its category penetration in Vietnam, we relied on share of search to devise a brand growth tracking model that offers clear answers to a whole host of strategic questions: How is the category interest developing in the urban and rural areas? What is the brand’s share of category search in the different areas? How to explain the discrepancy in search interest and sales?
How to take advantage of the regional differences to foster brand penetration success?
This brand growth tracking model is based on two key metrics, Category Health and Brand Momentum, which we combined into a matrix that already provides most of the answers. Additional qualitative research building upon the results takes care of the remaining ones.
Category Health and Brand Momentum
The first key metric, Category Health, represents the category search interest per capita (net users) in percent for all defined regions during a given time period. Converted to a percentage, it reveals the exact state of category penetration per region. Regions with a growing category penetration are usually the ones to be prioritized in terms of marketing activity. It should be noted that when it comes to developing markets such as Vietnam, it is important to calculate the search interest per capita and not just to perform a simple category search volume analysis. The latter might yield misleading results as the amount of internet users in the poorer regions is still rapidly growing, potentially suggesting a higher category growth than it should.
Brand Momentum on the other hand refers to the brand’s share of category search in percent for all defined regions during a given time period. It is calculated simply by dividing the total number of searches for a brand by the total number of searches for all brands in the category – repeated for all regions.
In our case, we calculated these key metrics for our client’s brand, six competing brands, 58 Vietnamese provinces plus 6 key cities (about 35 percent of the Vietnamese population lives in these major cities) and using a Year-over-Year time period.
A powerful regional insight matrix
After calculating both key metrics, we entered them into a matrix that proved to answer many of the existing business questions by itself. We came up with the idea when the client wondered why the growing total category search interest was not translating into sales for him as much as it should have. One explanation was that the client‘s share of search (Brand Momentum) was particularly high in regions with shrinking category penetration (lower Category Health), but lagged behind competitors in the growing regions (higher Category Health).
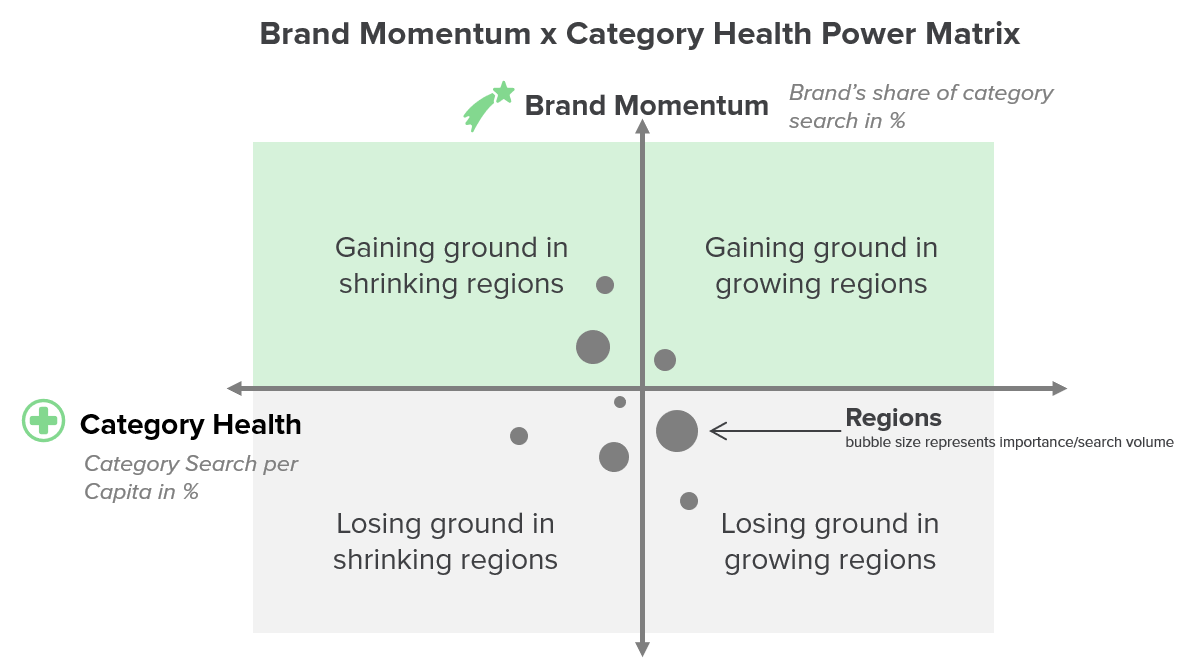
By simply laying together both key metrics using the cross matrix outlined above, we were immediately able to see that the client’s Brand Momentum was indeed particularly high in declining Category Health regions. As the data has shown, those low health regions surprisingly turned out to be the urban high-income areas, while the poorer rural areas were the ones with growing Category Health. Constructing the same matrix for the competing brands, we noticed that the top competitor enjoyed a substantially stronger Brand Momentum in these growing regions.
Accordingly, the matrix allowed our client to pinpoint exactly which region he should focus on in order to increase his category penetration through his Vietnam marketing activities to convert the increased category interest into more sales. Of course, it also provided a very neat visual overview of the category penetration in all regions as well as a proxy for the brand’s share of market down to province level. Openly available and quickly retrievable search data is all we needed to obtain these high-level insights and we had all the base analyses completed within two weeks. Can traditional market research compete with that?
It should be noted that this model can also be created using Baidu and Yandex data, feasible for projects in China and Russia.
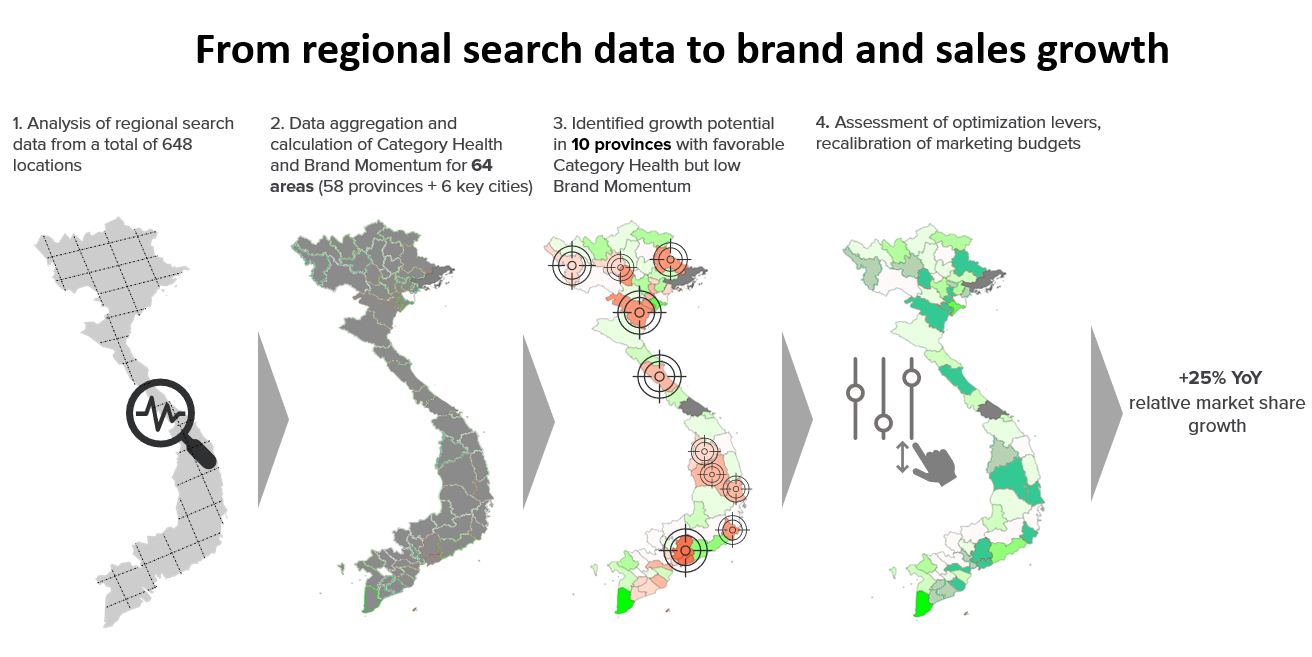
Figure 2: Outline of the four major steps that we followed to significantly increase our client’s relative market share in Vietnam based on regional share of search data.
Moving from insights to brand growth and sales
The insights generated from this share of search-based approach not only tell marketers a clear story of how they should optimize their big country-specific strategic marketing plan, but also how to create a differentiated plan per province or region.
In our case, the client managed to realize a market share growth of 25% within six months by calibrating his marketing spend through regional prioritization without increasing his total spend.
There are many other ways to use the model outlined above as a basis for maximizing marketing success in a region. Marketers could go further by updating the data in frequent – even daily – intervals resulting in a sophisticated near real-time brand growth tracking. This allows for accurate short-term measurements of marketing success as well as on-the-fly marketing steering, enabling quick reactions to current developments and helping brands gain a competitive edge. Or add a “Brand Advocacy” metric based on brand sentiment and share of buzz to better understand why exactly a brand performs better than another in a certain region and how the target audience perceives them.
Thanks to regional data on brand and category growth, a quote attributed to Henry Ford about the “wasted half of advertising” might get a new layer: How much better can advertising be when we balance out marketing activities according to regional requirements?
To sum up, share of search is not just another marketing hype. This case clearly demonstrates how regional share of search data enables uncovering enormous growth potentials for brands performance that would otherwise likely remain hidden, and this is just one promising use case of many. Apart from the needed expertise, the range of applications for share of search data is only limited by imagination.
Lastly, coming up with creative ways to use share of search is not something that should be left to the data wizzes alone. For CMOs and brand strategists, familiarizing themselves with the topic and assuming a leading role in driving share of search projects would be a good way to regain some of the relevance they have been consistently losing over the last years.
ALLE BEITRÄGE